Anyone working to manage a large Google workspace environment as an administrator knows how many different things can go wrong in different ways. It’s anything but a well-oiled machine. Sometimes it seems like a miracle that anything works, even before you get into non-standard configurations, third-party apps, and external services.
Thankfully, Google knows that things can go wrong and offers a variety of tools for Google Workspace (Formerly G Suite) administrators to help diagnose and fix problems that crop up.
There are ten tools provided in this toolbox. In this post, we’ll review each one in detail to learn what they do and how you can use them.
1: Browser Info
The first two in this list are a simple client-side reading of a browser and the surrounding information relevant to accessing the web and various Google services using that client’s setup.
As a Google Workspace / G Suite administrator, you will generally have your client/customer open up this page and either copy or screenshot the information for you. If you’re in person, you can open it on their machine.
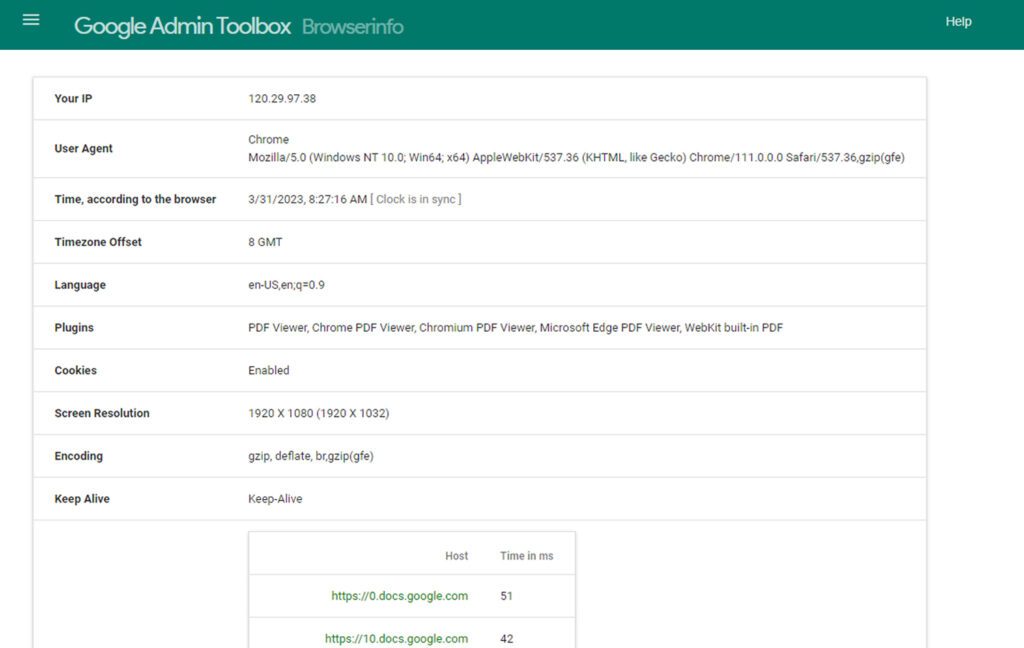
What does it show you?
- The client IP address.
- The client user agent for browser information, including browser and OS info.
- The browser’s local time, since time desyncs can cause problems (it also tells you if the clock is in sync.)
- Timezone offset from GMT.
- The environment language.
- The browser plugins that are installed and active. Note: This isn’t a complete list.
- Whether or not cookies are enabled.
- The screen resolution of the client’s computer.
- The encoding standard that is in use.
- Keep-Alive status.
- Firewall responses to various Google servers.
All of this is basic and standard information. It’s a helpful tool because it shows you what Google sees from the client and can tell you if anything is wrong, like a clock that is out of sync, a specific Google server is blocked at the firewall level, or another setting is incorrect.
2: User Agent
The first tool on this list provides a user agent string; this one breaks down that string and tells you what each component means.
There is only value in this tool if you know what the individual components of a user agent string mean. But, if you don’t know, aren’t sure of an element of it, or need a specific report, you can use this page to give you a complete reading of what each component of the client’s user agent string means.
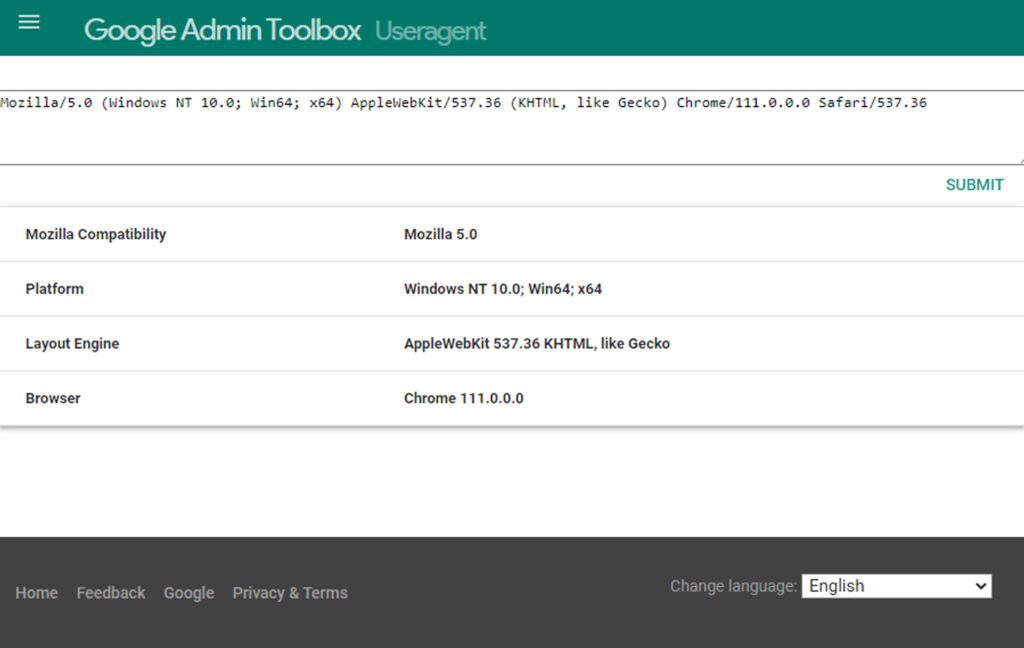
Again, this is a client-Google tool, so you need the affected individual to open it up and give you the information it contains.
3: Check MX
Dealing with email is the bane of many IT departments, and even though Gmail and Google Workspace make it easy to manage, there are still a million different ways it can go wrong.
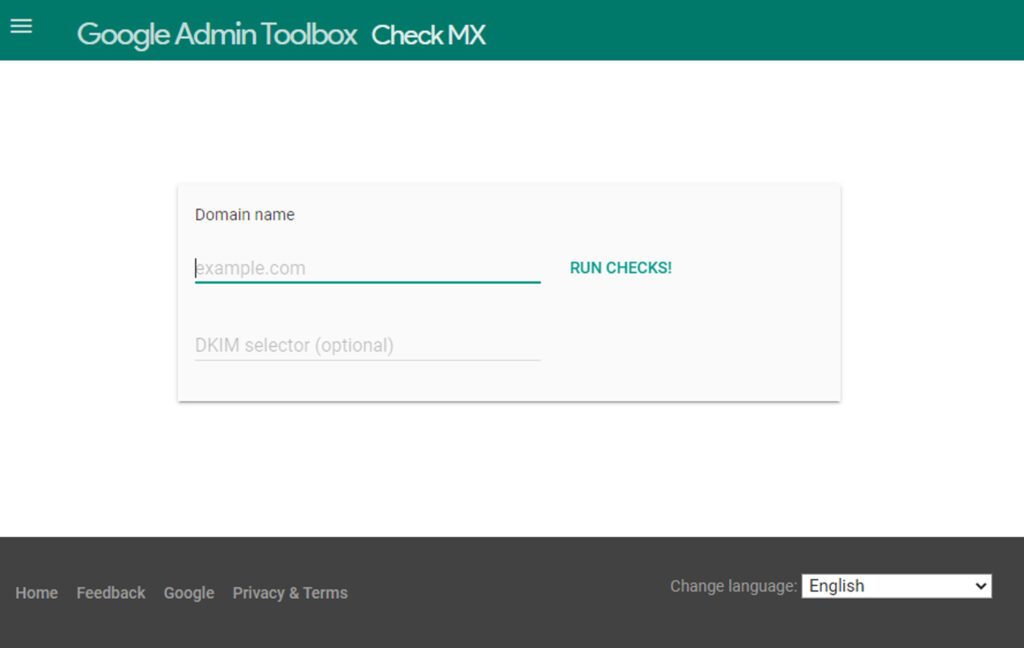
Check MX is a tool to analyze and diagnose issues with the configuration in an MX record. The MX mail exchange record specifies where traffic should go between standard web servers and email servers.
While this might sound simple, there are many different ways this record can go wrong and cause problems with your email within your organization. Some of them are limited in scope, some are organization-wide, and some are invisible until someone realizes they haven’t gotten any email today and they’re expecting critical emails, which is affecting production; fix it now!
Ahem. So, it can be a convenient tool to have on hand.
All you need to use the tool is your domain name and an optional DKIM selector. Plug it in, and Google will analyze your existing MX record and point out configuration problems you can fix.
4: Dig
Unix, which currently powers a considerable portion of the internet ecosystem and establishes a command framework that many other systems use, has a lot of different commands you can use to look up information. One of those commands is Dig.
The Dig command is a DNS lookup command. The Google version is a browser-based shell to look up and provide you with the same information; this is a favorite among most sys admins due to its simple UI.
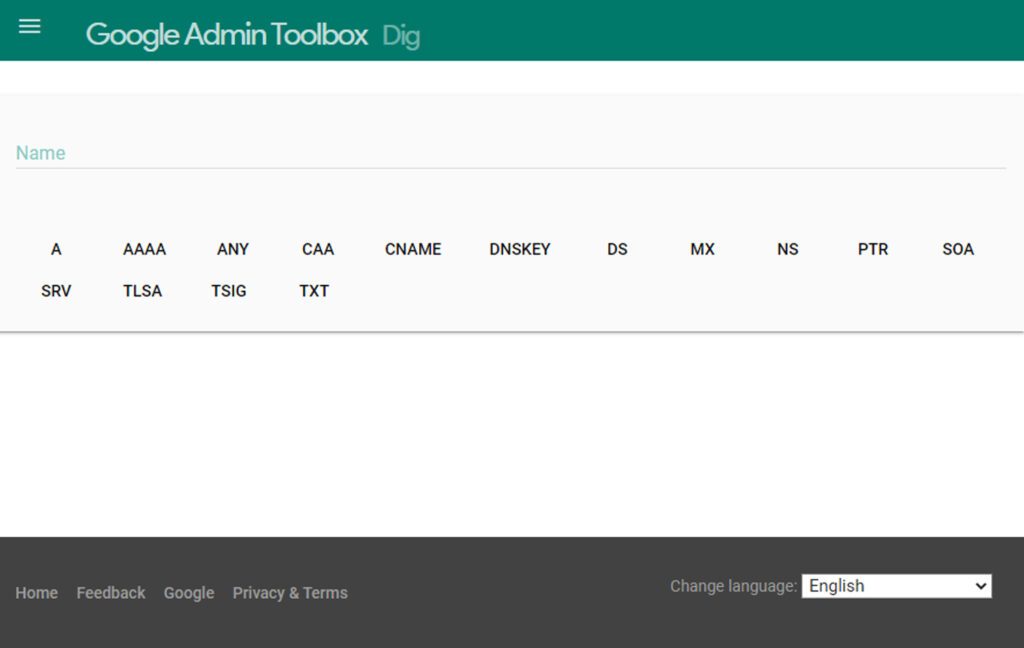
You can plug in your domain name and choose one of the parameters (or click ANY to get them all), and you’ll be given information like:
- The A record of the server IP address.
- The AAAA record of the IP address in IPv6.
- The CAA record, if any.
- CNAME.
- DNSKEY.
- MX records.
- NS.
- PTR.
- SOA.
- SRV.
- TLSA.
- TSIG.
- TXT.
Not every domain will have every kind of record, so using this tool appropriately means knowing what records you should and shouldn’t have and what they should say.
5: HAR Analyzer
A HAR file is an archive file of HTTP information formatted as a JSON file. These files are incredibly powerful logs of interactions between a client and a server and can be used to diagnose many different problems. They’re also full of potentially sensitive data, so you need to enable logging to get the file and then use a tool like this to extract and analyze it.
To use the tool, you enable logging on an affected client’s browser, then go through the steps to reproduce the issue as it occurs; this generates a HAR file for you, which you can then plug into the analyzer to read.
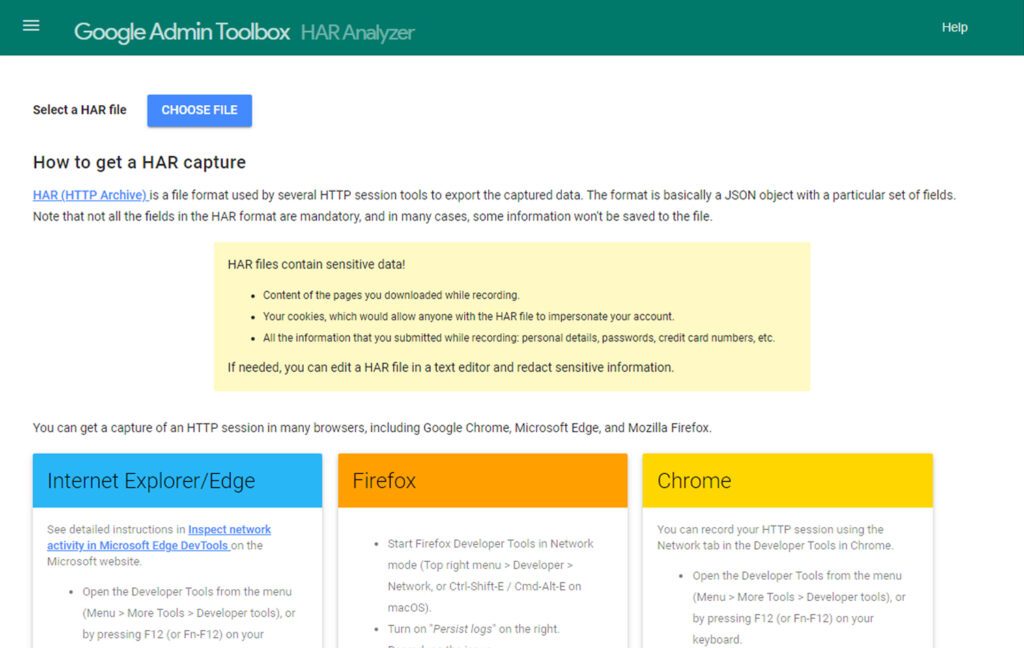
You’ll be able to see detailed logs of interactions between the client and server and diagnose where something went wrong.
You can open HAR files in text editors so you can redact sensitive information if need be, but if you’re using it for solely internal use, this may or may not be necessary.
6: Log Analyzer 1 and 2
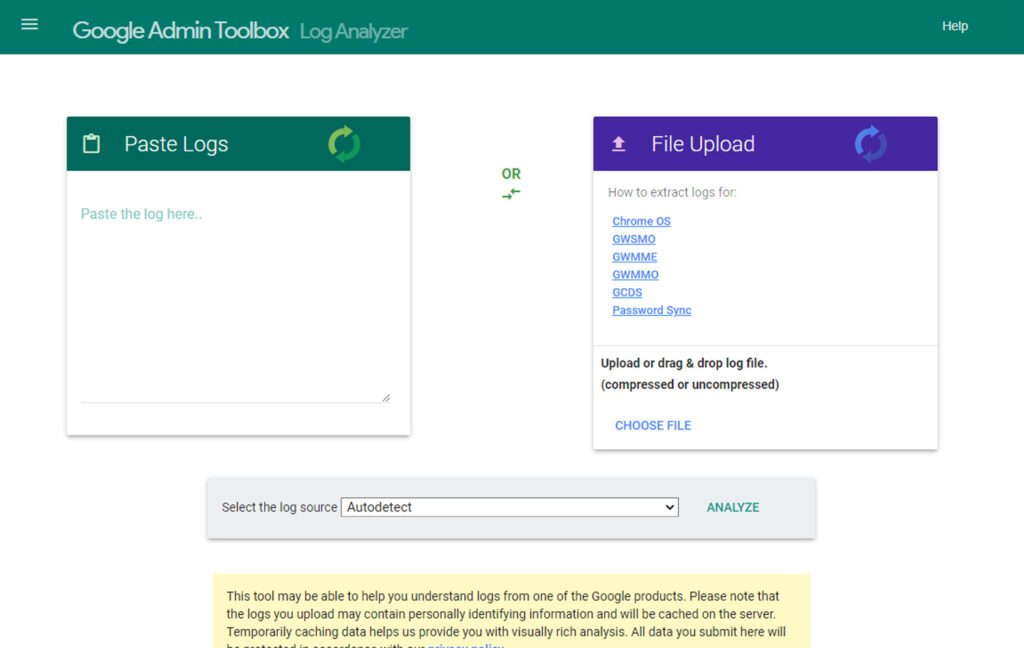
Log Analyzer analyzes log files generated by Google products, like Chrome, Workspace Sync, and Cloud Directory Sync, mainly when something goes wrong. To use the tool, you need the log file (of course), and you either paste the contents into the window or upload the file to the tool.
Google’s analyzer will temporarily cache the information and automatically detect which service generated the log.
![]() Note: Not all logs work with this tool. Some are too large for the tool to parse in one go. Others are generated by Google services that aren’t supported by this tool.
Note: Not all logs work with this tool. Some are too large for the tool to parse in one go. Others are generated by Google services that aren’t supported by this tool.
Luckily, there’s a solution: Log Analyzer 2
Log Analyzer 2, or LoggerShark, is another log analysis tool similar to the first.
Instead of uploading the file, the tool is powered by scripts on the page and runs locally, displaying results in your browser window. It also looks for known issues and everyday problems and provides solutions. Overall, it’s a powerful tool for specific situations with certain Google products.
7: MessageHeader
SMTP, the Simple Mail Transfer Protocol, is the protocol used for a lot of email delivery. SMTP message headers include delivery information and can help you diagnose why there are delivery delays in your email system relating to Gmail.
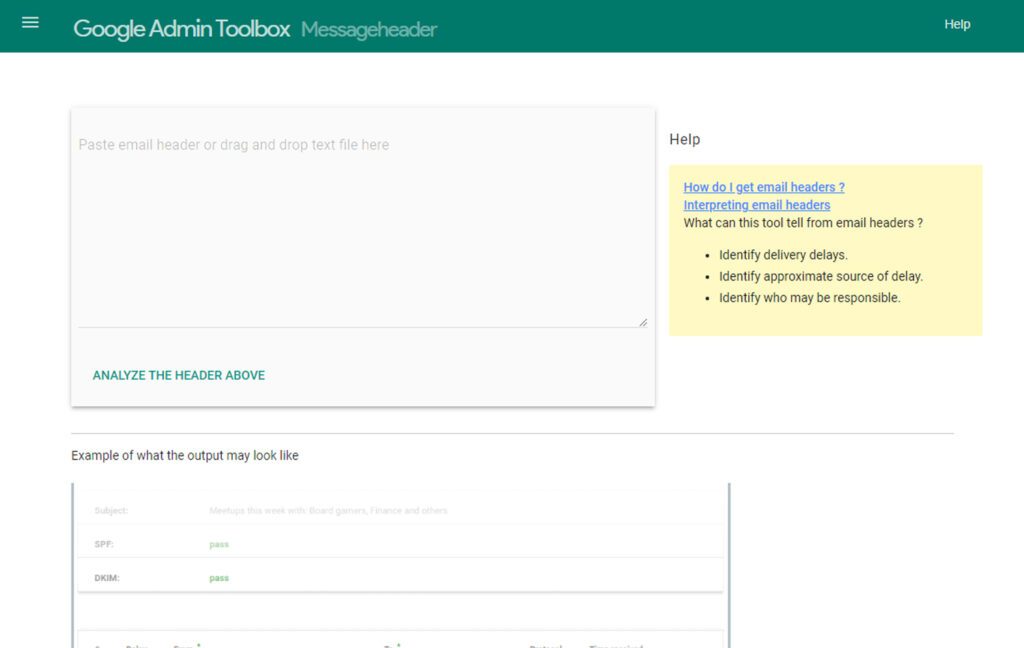
Now, doing something with that information – that’s the hard part. You need to know how to get the message header, and you need to know how to interpret the results it gives you, but that’s a low bar to clear.
8: Encode/Decode
Often, you’ll run into strings encoded in some way, or you’ll need to encode a string to make it work in the context of your troubleshooting. There are a million different tools for encoding and decoding those strings; this is one such tool.
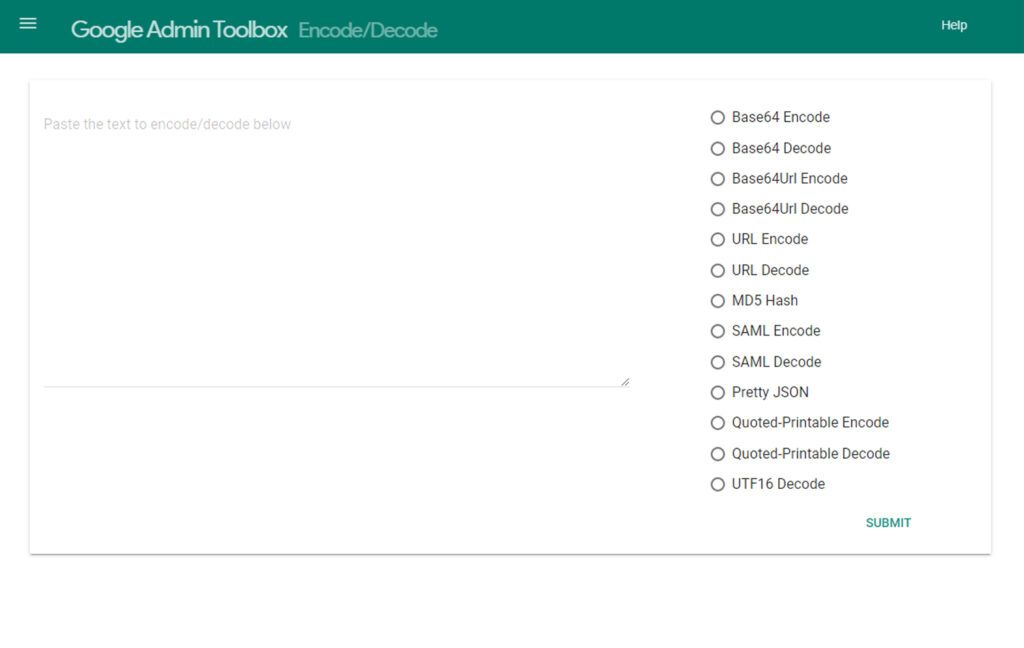
With it, you can encode or decode in:
- Base64
- Base64URL
- URL
- MD5 Hash
- SAML
- Pretty JSON
- Quoted-Printable
- UTF16
Overall, it’s a handy tool for quick conversions with text strings. It’s nice to have the various encoders and decoders in one place, though there are other ways to do all of the same processes.
Still, many of those free tools are littered with ads and may not be reliable, so if you’re going to handle these processes, you can have some confidence in using Google’s official tool.
9: Screen Recorder
Sometimes you’re unable to be in the same room as your client to troubleshoot their issues. Sometimes they need help adequately describing what is happening, or what they may be doing wrong, and the simplest solution is to get a recording of what they see.
A screen recording here means a JavaScript applet that records the browser window and the audio and gives you a file to view the recording. Google doesn’t store or process this file; it’s all local, so you don’t have to worry about them seeing something they shouldn’t.
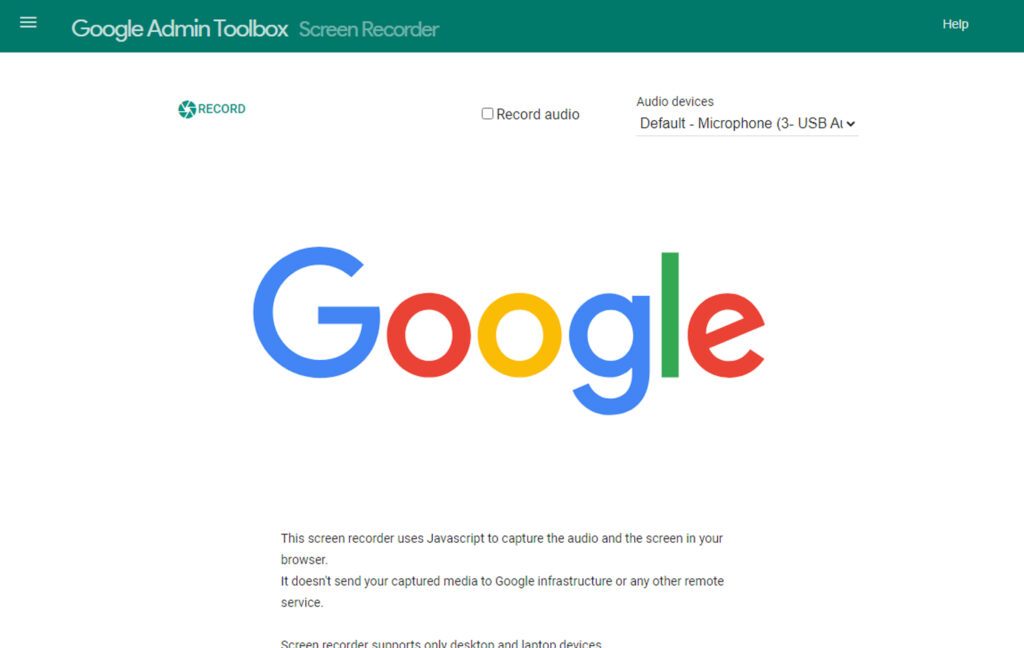
![]() Note: This tool requires you to use a computer and won’t work on mobile devices, and it needs a Chromium-based browser to function (Google Chrome, Microsoft Edge, Brave, Opera, etc.).
Note: This tool requires you to use a computer and won’t work on mobile devices, and it needs a Chromium-based browser to function (Google Chrome, Microsoft Edge, Brave, Opera, etc.).
After recording, the user can download and share the video through Google Drive or other means.
10: Additional Tools
While I said there were ten tools in the toolbox, there are actually a few more; just several of them are hidden under an “additional tools” header. They include:
The Google Calendar Troubleshooter. This is a support system flowchart that helps you walk through and identify potential issues with Google Calendar, what might have gone wrong, and how to solve the problem.
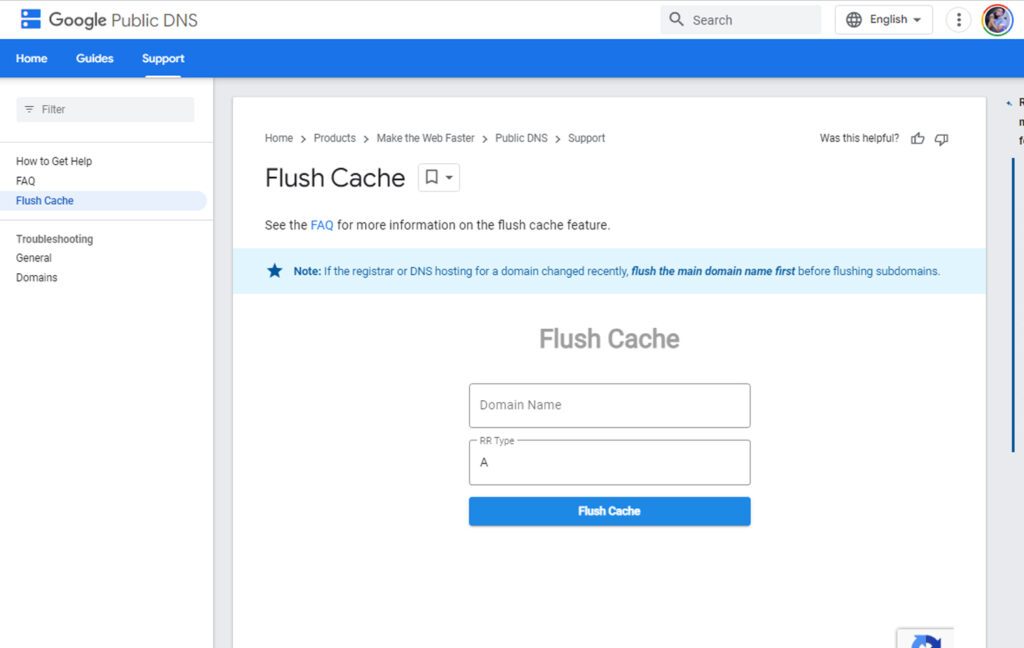
The Public DNS Cache Flush. Google maintains two DNS servers, 8.8.8.8 and 8.8.4.4, both of which share a DNS cache. When you make changes to your DNS records, the cache needs to be flushed or allowed to expire and refresh before your changes can propagate. This tool will enable you to request a flush of your DNS records from Google’s public DNS servers to speed up this process.
There’s a common poem amongst IT folks:
It’s not DNS
There’s no way it’s DNS
…It was DNS.
DNS causes so many problems in so many different ways that having an easy tool to identify and troubleshoot DNS records is excellent to have on hand.
- The Gmail Troubleshooter. Much like the calendar troubleshooter, this is a tool specifically for one Google service (Gmail) and operates like a support flowchart. Pick through the issues to find yours, follow the steps, and see if you can identify the root cause of whatever problem you’re having.
- The Chrome Connectivity Diagnostics tool. This is actually a browser plugin for Chrome, found on the Chrome web store. It includes a bunch of different troubleshooting tools for both Chrome and ChromeOS.
- The WebRTC Troubleshooter. WebRTC is a Real-Time Communications codebase, essentially the core of apps like Zoom, Hangouts, Teams, and more. The testing tool here allows you to look for issues with this system and any apps that use it.
Between all of these different tools, a Google Workspace admin should have everything they need at their fingertips to diagnose and troubleshoot problems involving the Google ecosystem, or at least the most common issues. There’s always going to be room for problems with third-party applications, API integrations, and external services, so you’ll need to be familiar with the troubleshooting process for any of those that you use as well.
On top of all of this, Google has a very extensive help center full of documentation on just about anything. There are also a number of third-party tools that you can use to increase your efficiency. Of course, it’s not the easiest to navigate (often the best way to find a page about a product is to use Google’s search), but it’s still very robust. There’s also always the wealth of information from third parties who have the same issues you do, but as a sysadmin, you’re probably more than familiar with that means of troubleshooting.
If you need more than these, there are also dozens of third-party tools for just about everything, from productivity to migration to collaboration to administration. Google makes it relatively easy to create an app to do whatever you need to be done, so if a tool you need doesn’t exist, you can always make one for your organization as well.
For example, consider how few ways there are to sort and organize files in Google Drive. You can’t easily sort to find the largest, oldest, least-used files, or even hidden files, to clean up or delete them from your account.
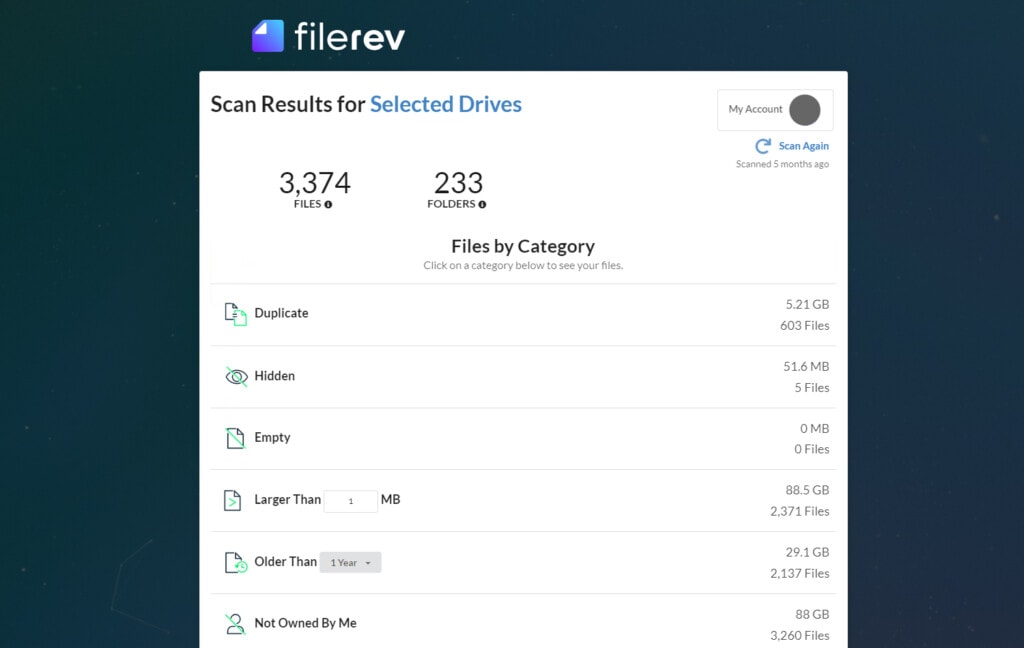
That’s why I made Filerev, a tool to do exactly that. Whatever you need, there’s a way to do it in the broader Google ecosystem.




Leave a Reply